Scenario #1
Shoaib Akhtar bowled a record delivery in World Cup 2003 against England at 161.3 km/h. A batsman stands 17.5 m away and must react quickly.
Scenario #2
Wasim Akram delivers another ball at 150 km/h on a slower pitch, and a batsman positioned at different distances tries to judge the minimum reaction time required.
Scenario #3
A student incorrectly converts Shoaib Akhtar’s bowling speed from km/h to m/s and calculates reaction time for a batsman, leading to an inaccurate gameplay analysis result.
Scenario #4
Shanghai’s Maglev train travels 30 km in 7 minutes 30 seconds along a straight elevated track, and engineers calculate its average speed for performance evaluation under test conditions.
Scenario #5
Transportation authorities compare Shanghai Maglev performance with motorway speed limits of 120 km/h to evaluate efficiency differences and public transport advantages in high-speed rail systems.
Scenario #6
A car moves along a curved 800 m track in 40 seconds, then scientists compare it with straight-line motion to understand differences between average speed and velocity in motion analysis.
Scenario #7
Engineers test a vehicle on two paths: a curved track and a straight road, both connecting the same points, to analyze how path shape affects motion quantities like speed and velocity.
Scenario #8
A physics class compares motion results of a car and notices that average speed and average velocity differ, leading to discussion about scalar and vector quantities in kinematics.
Scenario #9
A cheetah accelerates from rest while chasing prey in open savannah, reaching a final velocity of 26.8 m/s towards East in 3 seconds, showing extreme biological acceleration capability.
Scenario #10
Engineers compare cheetah acceleration with typical car acceleration (3–4 m/s²) to understand how biological systems outperform mechanical vehicles in rapid speed changes over short time intervals.
Scenario #11
A 2 kg block is dropped freely from the top of a tall building. It falls under gravity without air resistance and reaches the ground with a high final speed.
Scenario #12
Engineers studying building safety analyze how long falling objects take to reach the ground to design protective systems that reduce impact damage in urban construction environments.
Scenario #13
Students incorrectly assume that heavier objects fall faster, but experiment with 2 kg block shows identical acceleration due to gravity, helping them understand Galileo’s principle of motion in vacuum.
Scenario #14
A car starts its journey from Peshawar on Motorway M1 and moves uniformly towards a rest area located 100 km away, reaching it in exactly 1 hour without any interruption.
Scenario #15
After a 30-minute rest at the motorway service area, the car continues its journey and travels 75 km to Islamabad in exactly 1 hour under steady driving conditions.
Scenario #16
A car starts from rest and accelerates uniformly to 40 m/s in 25 seconds. It then travels at constant speed for 35 seconds before braking uniformly to rest in 15 seconds.
Scenario #17
A vehicle accelerates uniformly from rest to 24 m/s in 12 seconds, then maintains constant velocity for 18 seconds, and finally stops uniformly in 6 seconds due to braking.
Scenario #18
A driver moves a car with changing motion: first accelerating, then constant speed, and finally braking. Students are analyzing slopes and areas of a speed-time graph carefully.
Scenario #19
A sports car travels on a straight highway where its speed is measured using different unit systems. Engineers need to convert speed values from kmh-1 to ms-1 for accurate physics analysis and safety calculations.
Scenario #20
In motion studies of vehicles on different planets, acceleration values are sometimes given in kmh-2. Scientists convert these values into ms-2 to apply Newton’s laws correctly in SI units.
Scenario #21
On a straight road, a cyclist and a motorcar both start moving under different conditions. The cyclist gradually increases speed while the car starts from rest and rapidly accelerates. Both motions are observed over the same time interval to compare their acceleration behavior.
Scenario #22
Two vehicles are observed on a straight track. One is a cyclist who slightly increases speed, while the other is a car starting from rest and quickly reaching a higher velocity. Both are measured over a 10-second interval for comparative analysis.
Scenario #23
A student throws a ball vertically upward in a physics experiment. The ball takes exactly 2 seconds to reach its highest point before momentarily coming to rest under gravity.
Scenario #24
During a classroom demonstration, a ball is projected vertically upward on a planet where gravitational acceleration is 3.7 m/s², and it takes 2 seconds to reach the highest point.
Scenario #25
An athlete throws a ball upward from ground level with sufficient speed so that it momentarily comes to rest after 3 seconds in air, assuming constant gravitational acceleration.
Scenario #26
A car travels with uniform velocity of 20 m/s for 20 seconds on a straight road, then the driver applies brakes causing uniform deceleration and the vehicle stops completely after 60 seconds.
Scenario #27
A vehicle initially moves at 30 m/s for 10 seconds before brakes are applied, then it slows uniformly and comes to rest in 30 seconds due to constant deceleration.
Scenario #28
A driver increases the initial speed of a car while keeping braking force constant and observes that stopping distance increases significantly during emergency braking.
Scenario #29
A velocity-time graph shows a horizontal line followed by a straight downward sloping line representing uniform deceleration until the object stops completely.
Scenario #30
A girl rides a racing bicycle at a constant speed of 50 km/h. She applies brakes and slows uniformly until she comes to rest in 60 seconds.
Scenario #31
A cyclist initially moving at 13.89 m/s starts braking smoothly and comes to rest after 60 seconds.
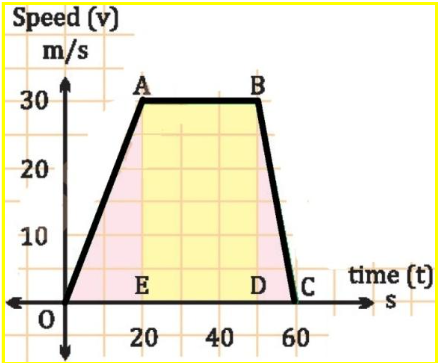
Scenario #32
A speed-time graph consists of three segments OA, AB, and BC showing increasing, constant, and decreasing speed respectively.
Scenario #33
A bus starts from rest, accelerates uniformly, moves at constant speed, and finally slows down uniformly as shown on a speed-time graph.